
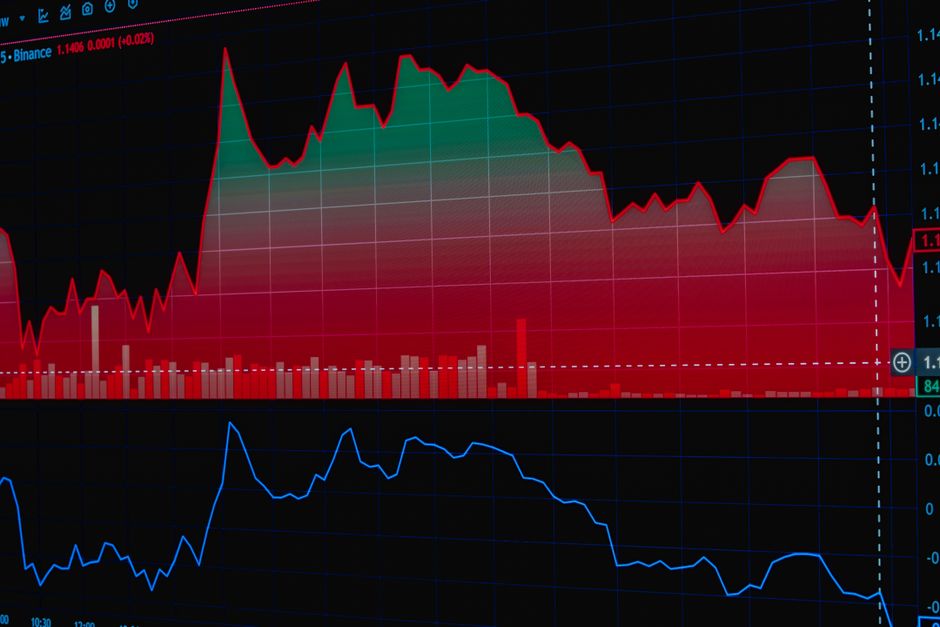
Analysis of Five Financial Indicators Suggesting Potential US Market Overextension
Financial analysts are highlighting five specific market charts that suggest US stock valuations may be reaching unsustainable levels. These indicators are being used to warn investors of potential volatility or a market correction in the near term.
Recent financial commentary has focused on five specific data charts that market analysts argue are signaling danger for the current US stock market environment. The core of the concern lies in the concept of 'stretched' markets, where asset prices have risen significantly faster than historical averages or underlying economic fundamentals would typically justify.
While the specific charts are not detailed in the initial report, the general consensus among market observers cited is that current valuation metrics—such as price-to-earnings ratios and market breadth—are flashing warning signs. Proponents of this view argue that the rapid pace of growth in major indices has left little room for error, making the market vulnerable to even minor negative economic news. Conversely, some market participants maintain that these indicators are lagging metrics that fail to account for the unique technological and productivity shifts currently driving corporate earnings.
There is a notable disagreement regarding the interpretation of these signals. Some analysts view the charts as a definitive precursor to a market correction, while others suggest they are merely a reflection of a new, higher-valuation normal for the US economy. The Reuters report frames these indicators as a 'sound of alarm,' emphasizing the risk to investors who may be over-leveraged in the current climate. As of now, the market continues to trade near record highs, creating a disconnect between the cautionary signals in these charts and the actual performance of the major indices.
📡 Media Analysis
How each outlet framed the story — angles, word choices, and what they chose to push or ignore.
Used a alarmist tone to frame standard market valuation metrics as an urgent warning.
"sounding the alarm"
✓ Only outlet to report: Identified that there are specifically five distinct charts being used by analysts to track market health.
⚡ Where Sources Disagree
- ·Whether current high valuations are a sign of an impending crash or a reflection of new economic realities.
🔍 What Nobody's Reporting
- ·The specific data points or metrics contained within the five charts were not identified.
- ·Lack of counter-perspectives from market bulls or institutional investors who disagree with the 'alarm' narrative.
📰 Sources
1 A-rated source(s) among 1 total. Lowest trust: Reuters Finance (A)